 SynLube™ Lube‑4‑Life®
" 100% Synthetic Super Lubricants, since 1969 "
Spectroscopy Analysis
INTRODUCTION
The basis of modern oil analysis is the use of optical emission spectroscopy (OES) to measure the ppm (parts per million) levels of wear metals, contaminants and additives in oil samples.
Whatever else an Oil Test Laboratory may measure, a multi-elemental analysis is the core of in-service oil analysis.
This article reviews the origins of OES as well as its application to in-service oil analysis resulting in the introduction of the Analysis Spectrometer.
Used Motor Oil Analysis (UOA) identifies the wear trends of the mechanism in which the lubricant is used (Vehicle or Equipment).
UOA is also useful in determining the ideal service life of the oil, as well as to predict any preventive maintenance service (PMS).
Typically about 3 to 4 ounces of the Fluid are required for testing.
History of Spectroscopy
Anders Jonas Ångström is credited with being one of the first people to observe discreet bands of color in hot gases.
He found it convenient to chart spectral bands in distances of 1 x 10⁻¹⁰ m.
This distance became know as the Ångström (Å).
Ångström is a unit of length, one of the fundamental metrics of nature, not some fancy unit that needs to combine several units like distance, time and force in a complicated way to come up with something useful.
So, it seems spectroscopy got a lot of respect right from the start!
Around the same time in the mid-1800's, two scientists, Gustav Kirchhoff and Robert Bunsen, were doing experiments together.
Most people remember Bunsen because the Bunsen burner was named after him, but he and Kirchoff were doing things a lot more serious such as describing the fixed lines of the solar spectrum, discovering new elements, and advancing understanding of optics and electrical engineering.
An easy demonstration of elemental identification by spectral emission is to introduce various elements into the flame of a Bunsen burner.
A little table salt and yellow appears from the sodium, some lithium salt gives a red flame from the lithium and copper compounds gave an intense green color.
It wasn't until many years later, when 20th century physicists, like Rutherford, Bohr, Einstein, Planck, Pauli, Schrodinger and Heisenberg worked out quantum mechanics and the behavior of atoms, that the existence of spectral lines and emission colors could be theoretically explained.
Principles of Spectroscopy
Spectroscopy is a technique for detecting and quantifying the presence of elements in a material.
Spectroscopy utilizes the fact that each element has a unique atomic structure.
When subjected to the addition of energy, each element emits light of specific wavelengths, or colors.
Since no two elements have the same pattern of spectral lines, the elements can be differentiated.
The intensity of the emitted light is proportional to the quantity of the element present in the sample allowing the concentration of that element to be determined.
How Spectroscopy Works
To explain in greater detail how Spectroscopy Works in general, we will use the element Sodium (Na) atomic number 11 as an example.
Sodium is frequently used as Corrosion Inhibitor in oils and coolants.
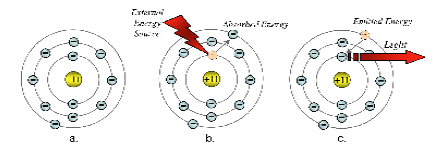
Figure 1 - Shell Model of the Sodium Atom
Figure 1 above provides a simplified view of the events that take place in the spectroscopic process.
To begin with, electrons surround the nucleus of the atom in well-defined shells.
The first shell, the most inner shell, accommodates only two electrons, the next shell holds eight and the third shell also holds eight electrons.
In the case of Sodium, there is only one electron in the outer shell orbital.
Figure 1a shows a sketch of an atom in its ground state. When an atom is cool, prior to excitation, the electrons in the atomic structure of each element revolve in their lowest energy or "ground state".
During excitation, whether it be by the heat of a flame, an electric arc or some other means, the atoms get hot and the electrons surrounding the nucleus absorb energy and rise to a higher energy state.
The "excited" electrons are temporarily forced away from the nucleus of the atom into a higher, unstable orbit, as in Figure 2b.
After reaching this unstable state, the electrons release this absorbed energy as they very quickly return to the ground or stable state.
The energy released has a specific value corresponding to the particular electron transition that has occurred in the excited atom.
The energy is given off in the form of light, as in Figure 1c.
The light has a specific frequency or wavelength (frequency is inversely proportional to wavelength) determined by the energy of the electron in transition.
Since many transitions of different energy are possible for complicated atoms which have many electrons, light of many different wavelengths is emitted.
If this light is dispersed by using a dispersing element, such as a prism, Figure 2 below, a line spectrum will result.

Figure 2 - Light dispersed by a prism
These spectral lines are unique to the atomic structure of only one element.
For the Hydrogen atom, with only one proton (positive charge of 1) in the nucleus and one electron (negative 1), the spectrum is fairly simple, See Figure 3.

Figure 3 - Emission Spectrum of Hydrogen
On the other hand, the spectrum of Iron with atomic number 26 (the nucleus has a positive charge of 26) is much more complicated with many emission lines in the visible spectrum corresponding to the many possible electronic transitions that may occur. See Figure 4.
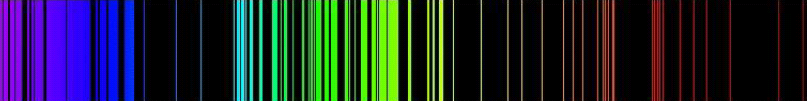
Figure 4 - Emission Spectrum of Iron
Figures 3 and 4 are showing only lines in the visible spectrum, which runs from about 400 nm (purple) to 700 nm (red).
There are many more lines, often the most intense for some elements, in the ultra-violet region of the spectrum. These cannot be seen as colors, but can be seen as dark lines on photographic film.
The intensity of the spectral lines is proportional to the concentration of the element present in the sample.
When more than one element is present in the sample, spectral lines of distinctively different wavelengths will appear for each element.
These lines must be separated in order to identify and quantify the elements present in the sample.
Usually only one representative spectral line among many possible choices is chosen to determine the specific element.
This line will be chosen for its intensity and freedom from interference from spectral lines of other elements. To accomplish this, extremely accurate optical system is required.
Since we have started with Sodium, lets see what the Sodium spectrum looks like in Figure 5 below.

Figure 5 - Emission Spectrum of Sodium (Na)
The spectrum of Sodium with atomic number 11 (the nucleus has a positive charge of 11) is more complicated than Hydrogen with many emission lines in the visible spectrum corresponding to the many possible electronic transitions that may occur. But not as complex as Iron (Fe).
Atomic Absorption Spectroscopy (AAS)
One thing not yet mentioned is that when atoms of a certain type are present and they are exposed to polychromatic light (light of all wavelengths), they will absorb light at exactly those wavelengths at which they would emit light when they are excited.
This process is a lot more efficient if the atoms are already hot.
One type of spectrometer, namely an Atomic Absorption (AA) Spectrometer, is built around this principle.
Some sample is introduced into a flame. The flame needs to be as hot as possible.
Then light of the element being analyzed is directed through the flame.
This is done with special lamps, that contain excited atoms of the element being analyzed, so that they emit wavelengths characteristic of that element.
If none of the element is present in the sample, the amount of light going through the flame and being measured at the detector is at maximum.
As the concentration of the element of interest increases, the detector signal decreases.
Oxygen-acetylene and nitrous oxide-acetylene fuel are often chosen for AA spectrometers.
These flames achieve temperatures around 5400°F (3000°C).
As hot as that may be, it's inadequate for certain hard to excite elements.
AA spectrometers are capable of doing a good job analyzing typical elements of interest in oil samples, but they are rarely used for this purpose because they analyze only one element at a time.
While this yields extremely high accuracy, it is very time consuming, therefore expensive.
Such units are usually only used for research by Industry and Universities.
Optical Emission Spectroscopy (OES)
Spectrometers that look at the multitude of spectral lines from a heated (or "excited") sample, are called optical emission spectrometers.
All optical emission spectrometers consist of three main components, these components are:
- Excitation Source
- introduces energy to the sample
- Optical System
- separates and resolves the resulting emission into its component wavelengths
- Readout System
- detects and measures the light that has been separated into its component wavelengths
- presents this information to the operator in a usable fashion
Excitation Source
One typical method used in the excitation source in modern spectrometers is an electric discharge.
The source is designed to impart the energy generated in an arc or spark to the sample.
For oil analysis spectrometers, a large electric potential is set up between a disc and rod electrode with the oil sample in the gap between them.
An electric charge stored by a capacitor is discharged across this gap creating a high temperature electric arc which vaporizes a portion of the sample forming a plasma.
A plasma is a hot, highly ionized gas which emits intense light.
The light given off as a result of this process contains emissions from all the elements present in the sample.
These emissions can now be separated into individual wavelengths and measured using a properly designed optical system.
Temperatures in the 5000°C to 6000°C range are achieved and hard to excite elements emit enough light to be readily detected.
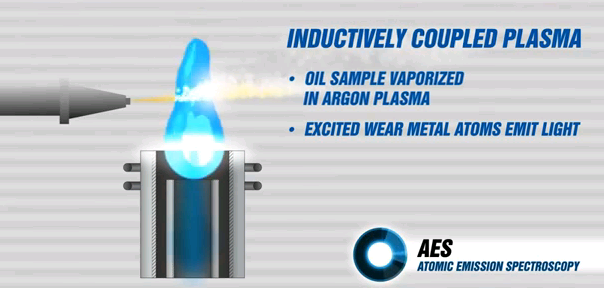
Another method of exciting the elements is to vaporize the sample in Argon plasma. The excited atoms of the test elements emit light.
Optical System
The purpose of the optical system in a spectrometer is to separate the light coming from the plasma into the discrete wavelengths of which it is comprised.
Most people are familiar with the phenomenon illustrated in Figure 2, in which a prism is used to separate a beam of white light into a spectrum of different colors or wavelengths.
Observing a rainbow effect generated by sunlight passing through a prism is one of the standard experiments in Physics.
The same principle is employed in the spectrometer, except that instead of a prism, an optical device called a diffraction grating is used to separate the discreet wavelengths. The diffraction grating is a concave mirror with very fine lines on its surface that causes incident polychromatic light to be separated into component wavelengths.
Figure 8 shows the Optical System component of an oil analysis spectrometer using a polychromator optic based on the Rowland Circle concept.
Light from the excitation process (burn) exits the fiber optic cable and passes through the entrance slit and is concentrated on the diffraction grating by a lens.
The entrance slit introduces light made up of all the elements present in the oil sample and defines the shape of the spectral lines at the focal curve after it is diffracted by the grating.
The purpose of the grating is to separate (diffract) this light into its component wavelengths.
The spectral lines can be photographed or electronically quantified by photomultiplier tubes (PMT's) or charge coupled devices (CCD's).
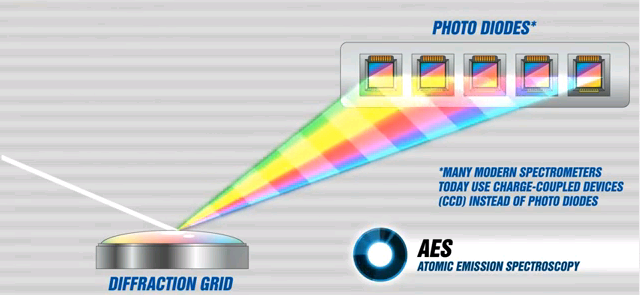
Figure 8 - Light dispersed by a Diffraction
An important consideration when designing a spectrometer is the region of the spectrum where the wavelengths of interest occur.
Many elements emit light in the visible region of the spectrum.
However, there are elements that emit mainly in the Far Ultra Violet (FUV) region of the spectrum.
This is significant because FUV radiation does not transmit well through air; rather, it is mostly absorbed. For the optic to see FUV spectral lines, it is necessary for the optical system to be mounted in a vacuum chamber or otherwise filled with gas transparent to FUV light, so that the emitted light can reach the grating, be diffracted, and then be detected at the focal curve.
Thus, a sealed chamber and a vacuum pump or gas supply system become part of the system.
Readout System
The readout system of the is controlled by an industrial grade micro processor and software.
A clocking circuit and amplifier periodically reads the charge on a CCD chip and converts it from an analog to digital (ADC) signal to measure the light that has fallen on a pixel.
The charge accumulated on a pixel is converted to an arbitrary number defined as "intensity" units.
At the end of the analysis, the total intensities for each element are compared to calibration curves stored in memory and are converted to the concentration of the element present in the sample.
Concentration is usually expressed in parts per million (ppm).
This information is displayed on a video screen, or can be printed out on a printer.
Once the analysis is completed and the results recorded, the system is ready for the next analysis.
The analysis results may be left on the screen, stored on the hard disk, or can be sent to an external computer.
User friendly software enables simple operation with automatic recalibration, while providing statistical functions for averaging and repeatability.
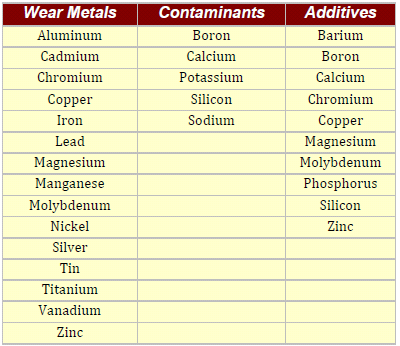
Spectrometers used in Oil Analysis generally detect only the elements that are listed in table below:
Equipment Limitations
What you almost never hear about from proponents of UOA are the inherent limitations that commonly used Spectroscopy equipment, that is used for Oil Analysis, has.
Therefore most recipients of the Result believe it is "absolute" and equate it with gospel.
The truth and reality, however, is that every equipment has its limits in accuracy, repeatability and range of size detection.
ACCURACY
Definition:
Accuracy refers to the correctness of a single measurement.
Accuracy is determined by comparing the measurement against the true or accepted value.
The difference between a measurement reading and the true value of that measurement is usually expressed in percent.
Spectrometer accuracy is determined by using plain oil sample with just one element dispersed in it at known PPM level.
For example: SAE 30 Oil with 100 PPM Iron
If the result is "exactly" 100 PM the unit is 100% accurate.
If the result is 110 PPM then the unit is 10% overestimating the true known value and thus has only 90% accuracy for the single reading.
REPEATABILITY
Definition:
The ability to obtain consistent results when measuring the same part with the same measuring instrument.
PRECISION
Definition:
The degree to which an instrument will repeat the same measurement over a period of time.
RESOLUTION
Definition:
The smallest change in a measured value that the instrument can detect. Resolution is also known as sensitivity.
While the Result Values in most UOA printouts are in PPM, that does not automatically mean that the measuring equipment has ONE PPM resolution.
ONE PPM Resolution is actually quite rare, and the typical resolution is in range of 3 to 5 PPM for most commercial grade units.
The reason why sometimes the resolution on the printout can appear as if it is actually ONE PPM, is that if the Result fluctuates during the brief measurement period, then Readout System averages the readings while considering the time duration and then "calculates" the "estimated" PPM.
So while the actual readings may be 3, 6, 0, 12; the "calculated" Result on the printout may be 7 even if the actual resolution is in steps of 3 PPM.
STABILITY
Definition:
The ability of a measuring instrument to retain its calibration over a long period of time. Stability determines an instrument's consistency over time.
Detection Limits
Almost never talked about or disclosed is the well hidden fact that every commonly used Spectroscopy equipment used for Oil Analysis has a "Detection Limit", which makes the instrument "blind" to particles that are over certain size.
The reason is that no matter which system of excitement is used, the elements that are detected must be completely "burned" in order to emit the detectable light.
Since it takes lot of energy to completely burn a metal in fraction of second, if the metal particle is too large, there is just not enough energy to burn it, and thus it goes "undetected".
The common particle detection limit generally is:
- Inductive Coupled Plasma (ICP)
- Wear Debris 1 to 3 micron in size
- No detection ("blind") of 5 micron and larger particles
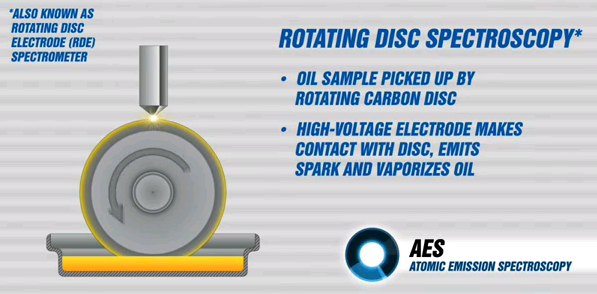
- Rotating Disc Electrode (RDE)
- Wear Debris 1 to 8 micron in size
- No detection ("blind") of 10 micron and larger particles
CALIBRATION
Definition:
The comparison of a device with unknown accuracy to a device with a known, accurate standard to eliminate any variation in the device being checked.
Standard
Definition:
A recognized true value. Calibration must compare measurement values to a known standard.
Drift
Definition:
The actual change in the measurement value when the same characteristic is measured under the same conditions, same operator, at different points in time. Drift indicates how often a measurement needs recalibration.
About UOA Test Results
We at SynLube Incorporated receive many e-mails with questions about oil tests performed by various laboratories, and how to interpret them.
This article should help you to understand the theory of Spectroscopy, the function of the test equipment, and the equipment limitations.
It is also important to understand that the Result Values for typical Oil Analysis are in PPM (Parts per Million) by "mass" or weight of the element.
Because we buy and install lubricants by volume, that is US Quart or Liter, it is sometimes hard to think of a relationship in terms of weight.
Following will illustrate the relative ratio of 1 PPM of Iron in Oil.
Small weights are very difficult to comprehend by human senses, so let us use the weight of ONE OUNCE which is equal to 28.35 grams.
If you have some spare change in your pocket, put five (5) U.S. Quarters into your hand.
If you have your eyes closed (so you can not see the coins), and your ears are plugged (so you can not hear the coins), and if the coins are at your body temperature (so you can not feel the colder to senses metal - if at room temperature), you will have hard time to sense the weight of ONE OUNCE !

Now for a moment imagine that the coins are from Iron, rather than the US Mint alloy and that they have been ground to "dust" particles that are about one micron in size.
Now guess how much Oil you would have to disperse the fine metal dust in to get the reading of 1 PPM of Iron on 100% accurate Oil Spectroscopy equipment ?
The answer is shown in the Figure 9 below:
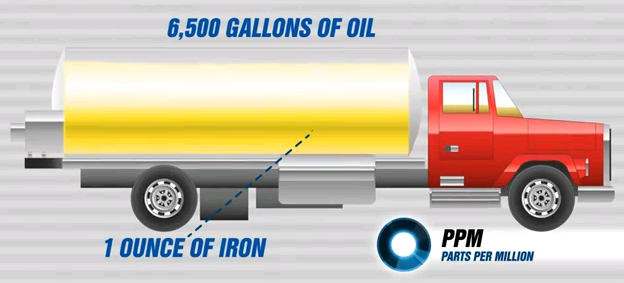
So while ONE OUNCE of metal is by weight rather small, and in "size" about equal to five US Quarter Dollar Coins, the weight of Oil needed to get 1 PPM dispersion is equal to 6,500 Gallons of Oil !
And again the 6,500 Gallons (24,605 Liters) of oil is also hard to perceive, and indeed it is a volume that would fill a typical Tanker Truck.
100 PM of Iron in Oil is commonly the "flag" that most Laboratories use as "Critical" or "High Wear".
But, let's say, if the UOA Result shows even 200 PPM, should you panic and disassemble the engine because for sure there is a "serious" problem ?
Or should you question the accuracy of the Test Result ?
Get another test of the same oil sample from the same Laboratory, or how about a different Laboratory ?
You definitely should !
And once you test the SAME oil sample again, will the Results "match" or will they have high degree of "variance" ?
Test the TEST Lab
In real life applications customers that patronize UOA Laboratories generally send out a test sample AFTER used motor oil was already drained.
The drained used oil is almost always disposed of immediately after the drain, so a second sample for "re-testing" or "confirmation test" is never available.
Therefore customers of UOA Laboratories almost never find out how accurate are the Results for a given sample.
If you are seriously interested in utilizing UOA as part of your maintenance and if you decide to depend on the Laboratory Results for insight into the Wear Patterns of your equipment or for determining the ideal Oil Drain Interval, then FIRST "test" the Lab itself !
Here is how to do it:
- Set aside a Fresh Oil Sample
- Take three Samples from Used Oil Drain
- Send the FRESH and TWO of the USED Samples to the Lab, but label the Used Samples as Unit #1 and Unit #2
- Send the THIRD Sample to the Lab two weeks latter
- When you receive the results for all the four Tests compare them and you will see how accurate and consistent the Laboratory actually is
Now you will know if you can take their Results seriously or not.
What to Look for
FRESH versus USED
All the "additive" chemicals in the USED Sample should be LESS than in the FRSH Oil, the engine simply can not make MORE elements in the Oil that the Oil had in it to begin with.
If the "additives" Results are GREATER than those in FRESH Oil the Analysis is not very accurate.
Unit #1 versus Unit #2
You know it is EXACTLY the same Sample but in two bottles, but the Laboratory does not know this and they will generally test one Sample immediately after the other from the same customer.
There fore the results for Unit #1 and the Unit #2 should be IDENTICAL, but it would be very rare if they actually were !
This will give you some idea on how REPEATABLE are the Results from this Laboratory.
If the numbers do not match very well, best look for another Test Lab.
Sample #3
Even if the Unit #1 and Unit #2 Samples were a reasonably good match, a Sample tested two weeks latter, may not be.
This will tell you how consistent the Laboratory is over time, and if they keep their equipment properly Calibrated to get Reliable Results or not.
While such Testing of a Test Lab, may be expensive and time consuming undertaking, without it any Result you get from your Used Oil Sample can not be statistically relied upon with any confidence level.
Summary
Low cost oil analysis can be ONLY used for plotting of wear trend or oil viscosity change trend, any single test can not be used to indicate or predict equipment condition or oil quality.
There always MUST be comparison to FRESH oil analysis of the oil BEFORE it has been installed, as well as Oil that has been in the engine for about 200 miles or 5 hours.
This is because it is NOT possible to drain 100% of any previous lubricant from most mechanisms and values of slightly used oil may vary by as much as 20 to 50% when compared to FRESH UNUSED OIL.
Oils will undergo chemical changes when exposed to heat, which exceed 200°F.
During oil formulation and production conventional oils are not exposed to temperatures over 90°F and "true" synthetic fluids (PAO) seldom are produced at temperatures that exceed ambient or room temperatures of 70°F
To determine statistically meaning full trend based on OIL ANALYSIS following would have to be done:
- Sample USED oil that was previously in the Engine.
- Sample FRESH oil prior installation.
- Sample Low Mileage USED oil (about 200 miles)
- Sample Medium Mileage USED oil (about 2,500 miles)
- Sample High Mileage USED oil (about 5,000 miles)
Only the variation between the #4 and #5 tests can be used for a meaningful wear trend or oil deterioration projections, the other tests only serve as base lines to which initial oil composition comparison can be made.
Any SINGLE oil test of SynLube™ Lube‑4‑Life® will yield data that if compared to conventional petroleum or synthetic lubricants will result at best in "ABNORMAL" values or "FAIL" condition.
SynLube™ Lube‑4‑Life® is unconventional non-petroleum long-life lubricant therefore conventional oil test standards can not be applied to predict wear or oil condition if the FIVE-test plan shown above is not followed.
SynLube Incorporated has extensive experience with colloidal lubricants and of course with all SynLube™ Lube‑4‑Life® products, therefore we can either perform any requested or required oil analysis for our customers, or properly interpret results that are obtained from independent oil test laboratories.